Weekly Market Update, February 27, 2023
Weekly Market Update, February 27, 2023
Presented by Zachary R. Sturdy
General Market News
· The minutes from the February Federal Open Market Committee (FOMC) meeting were released last week and didn’t produce any big surprises. They indicated that, although price increases are slowing, inflation remains well above what the Federal Reserve (Fed) is comfortable with. The February 1 interest rate hike of 25 basis points (bps) received unanimous support from voting members, but the meeting notes show that multiple members were interested in a more aggressive rate change. While the call for a quarter percent increase prevailed, that meeting took place before multiple key releases, including January’s blockbuster jobs report, a falling unemployment rate, rebounding retail sales, and hotter-than-expected consumer prices. These economic developments—and those still to come before the next rate decision—will play a large role in the Fed’s March policy decisions. U.S. Treasury yields saw modest movements last week. The 2-year, 5-year, 10-year, and 30-year gained 4 bps (to 4.74 percent), 5 bps (to 4.16 percent), 10 bps (to 3.92 percent), and 3 bps (to 3.9 percent), respectively.
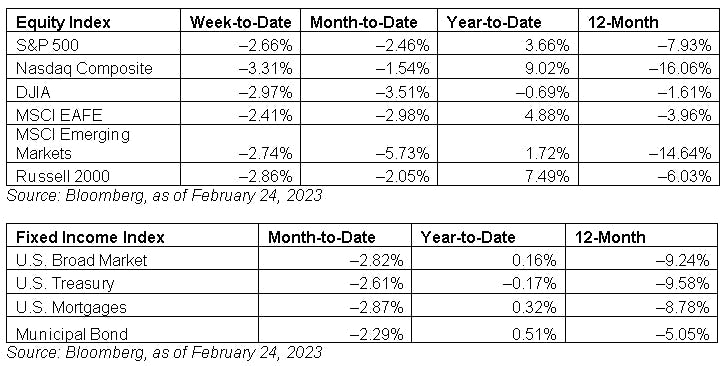
· Global markets sold off last week as they adjusted to additional rate hikes expected from the Fed. The result was that many of the sectors and names that had rallied since the end of October gave up some ground. The FAANG (Facebook, Apple, Amazon, Netflix, and Google) names were among those hit, with the latter four down at least 3.8 percent each. The dollar has continued its recent trend of strengthening on potentially more aggressive Fed policy and, as a result, the dollar increased 1.3 percent and gold fell by 1.8 percent. The Fed’s preferred inflation gauge, core PCE, showed its first increase since September 2022 on Friday, increasing 0.6 percent month-over-month. The indication for the short term is that the Fed continues to have its work cut out in taming inflation. Not surprisingly, the top-performing sectors last week were energy, materials, and consumer staples, all of which typically benefit from inflation. Sectors that underperformed were consumer discretionary, communication services, and REITs, which see spending and the higher cost of capital weigh on their businesses.
· The first major report came on Tuesday with the release of Existing Home Sales for January. The pace of existing home sales slowed for the twelfth consecutive month in January, as high prices, low supply of homes for sale, and high mortgage rates served as a headwind for the housing industry.
· Wednesday saw the release of the February FOMC meeting minutes, which showed that the majority of Fed officials favored a 25 bps hike at the February meeting. There were, however, a few that advocated for a 50 bps rate hike, which could indicate that larger rate hikes are possible later this year.
· Major releases wrapped on Friday with personal income and spending reports. Both personal spending and income grew in January. The rebound in personal spending growth after two months of declines highlights the resiliency of the American consumer and marks the largest monthly increase in spending since early 2021.
What to Look Forward To
This week’s data will continue to focus on the consumer, although we will also see data around business confidence.
Monday will see the release of the preliminary estimate of durable goods orders for January. Headline goods orders are set to fall following a transportation-driven surge in orders in December. Core orders are set to increase modestly to start the year.
On Tuesday, the Conference Board’s Consumer Confidence Survey for February will be released. Consumer confidence is expected to increase in February following a modest decline in January.
Wednesday will see another sentiment report in the release of the ISM Manufacturing survey for February. Manufacturer confidence is expected to increase in February; however, the index is set to remain in contractionary territory during the month.
Finally, the week will wrap on Friday with the other half of the ISM sentiment reports. The ISM Services report is expected to show a modest decline in February following a better-than-expected result in January. Despite the anticipated drop, the index is expected to remain in healthy expansionary territory.
Disclosures: Certain sections of this commentary contain forward-looking statements that are based on our reasonable expectations, estimates, projections, and assumptions. Forward-looking statements are not guarantees of future performance and involve certain risks and uncertainties, which are difficult to predict. All indices are unmanaged and are not available for direct investment by the public. Past performance is not indicative of future results. The S&P 500 is based on the average performance of the 500 industrial stocks monitored by Standard & Poor’s. The Nasdaq Composite Index measures the performance of all issues listed in the Nasdaq Stock Market, except for rights, warrants, units, and convertible debentures. The Dow Jones Industrial Average is computed by summing the prices of the stocks of 30 large companies and then dividing that total by an adjusted value, one which has been adjusted over the years to account for the effects of stock splits on the prices of the 30 companies. Dividends are reinvested to reflect the actual performance of the underlying securities. The MSCI EAFE Index is a float-adjusted market capitalization index designed to measure developed market equity performance, excluding the U.S. and Canada. The MSCI Emerging Markets Index is a market capitalization-weighted index composed of companies representative of the market structure of 26 emerging market countries in Europe, Latin America, and the Pacific Basin. The Russell 2000® Index measures the performance of the 2,000 smallest companies in the Russell 3000® Index. The Bloomberg US Aggregate Bond Index is an unmanaged market value-weighted performance benchmark for investment-grade fixed-rate debt issues, including government, corporate, asset-backed, and mortgage-backed securities with maturities of at least one year. The U.S. Treasury Index is based on the auctions of U.S. Treasury bills, or on the U.S. Treasury’s daily yield curve. The Bloomberg US Mortgage Backed Securities (MBS) Index is an unmanaged market value-weighted index of 15- and 30-year fixed-rate securities backed by mortgage pools of the Government National Mortgage Association (GNMA), Federal National Mortgage Association (Fannie Mae), and the Federal Home Loan Mortgage Corporation (FHLMC), and balloon mortgages with fixed-rate coupons. The Bloomberg US Municipal Index includes investment-grade, tax-exempt, and fixed-rate bonds with long-term maturities (greater than 2 years) selected from issues larger than $50 million. One basis point is equal to 1/100th of 1 percent, or 0.01 percent.
###
Zachary R. Sturdy is located at 307 S. Front St., Ste: 107 Marquette MI, 49855 and can be reached at (906)226-6056.
Securities and Advisory Services offered through Commonwealth Financial Network, member FINRA/SIPC, a Registered Investment Adviser. Fixed insurance products and services offered through CES Insurance Agency.
Authored by the Investment Research team at Commonwealth Financial Network.
© 2023 Commonwealth Financial Network®