Weekly Market Update June 21, 2022
Weekly Market Update June 21, 2022
Presented by Zachary R. Sturdy
General Market News
· The Federal Open Market Committee (FOMC) announced a 75 basis point (bp) hike in the federal funds rate after its most recent meeting. This is the base rate's largest increase since 1994 and brings the Federal Reserve (Fed)'s target range between 1.5 and 1.75 percent. This comes on the heels of a larger-than-expected inflation report for May, which showed an 8.6 percent year-over-year Consumer Price Index (CPI) increase. Expressing determination to tackle consumer prices, Fed Chair Jerome Powell also noted that an increase of 50 or 75 bps at the next FOMC meeting is certainly on the table. Following along with the federal funds rate, U.S. Treasury yields were up across the curve last week. The 2-year, 10-year, and 30-year rose 10 bps (to 3.17 percent), 7 bps (to 3.24 percent), and 9 bps (to 3.29 percent), respectively.
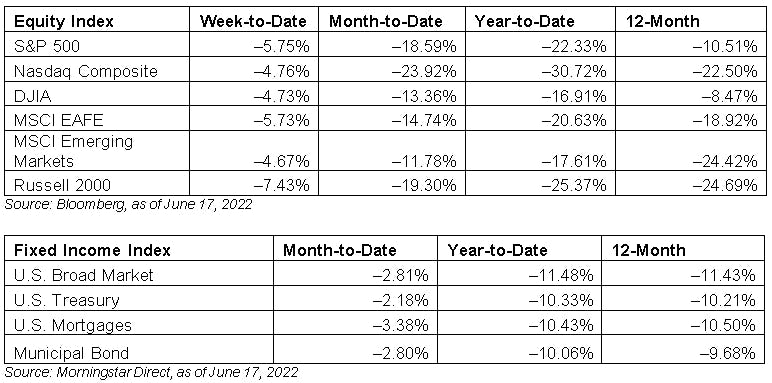
· Global equity markets had their worst week since March of 2020. Cyclicals sold off heavily as investors took a risk-off approach led by a sharp decline in the energy sector. Energy fell as the Bank of England and the United States FOMC voted to raise rates this week. Additionally, an emergency meeting was held by the European Central Bank as it vowed to support the more fragile economies in the European Union by selling German debt and purchasing Italian debt. This is an attempt to reduce borrowing costs within Italy. As bond yields and borrowing costs increase across the world, we have seen an opposite reaction in oil. West Texas Intermediate Crude fell by more than 10 percent last week as the future demand for oil amid a slowing global economy remains unknown. Other sectors that sold off were utilities, materials, and industrials, which had been tied to the run in energy and materials this year. Sectors that held up best last week included consumer staples, health care, telecom, and financials.
· On Tuesday, the Producer Price Index report for May was released. Headline producer prices increased 0.8 percent, up from the downwardly revised 0.4 percent increase we saw in April but in line with economist expectations. On a year-over-year basis, producer prices increased 10.8 percent, down from April’s 10.9 percent increase and slightly below economist forecasts for a 10.9 percent increase. Core producer prices, which strip out the impact of volatile food and energy prices, rose 0.5 percent during the month and 8.3 percent year-over-year against calls for 0.6 percent monthly and 8.6 percent year-over-year increases, respectively. Although producer inflation was in line with or below economist expectations, the report showed producer prices are still facing large amounts of upward pressure. Producer inflation has been fueled over the past year by high levels of demand, global supply chain issues, and rising maturity and labor costs. Given the market and economist expectations for continued high inflation in the months ahead, the Fed is expected to continue to focus on tighter policy throughout the year and into 2023.
· On Wednesday, the May retail sales report was released. Retail sales came in below expectations, as headline sales declined 0.3 percent against calls for a 0.1 percent increase. Much of the miss for headline sales growth was due to weaker-than-expected auto sales in May. Core retail sales, which strip out the impact of auto and gas sales, increased 0.1 percent. Despite core sales having grown for the fifth consecutive month, this increase indicated softening consumer demand for goods, likely reflecting pressure created by high levels of consumer inflation. Looking forward, inflationary pressure and rising rates are expected to serve as a headwind for significantly faster levels of sales growth. Since consumer spending drives most economic activity in the U.S., this report indicates that the Fed’s attempts to slow the economy to combat inflation may be starting to filter into economic data. Retail spending will be closely monitored in the months ahead to see if this is the start of prolonged consumer demand.
· Wednesday also saw the release of the FOMC rate decision from the Fed’s June meeting. The central bank started hiking interest rates at its March meeting with a 25 bps hike to the federal fund rate, followed by a 50 bps hike at its June meeting. The Fed hiked the federal funds rate an additional 75 bps at this meeting, which was 25 basis points higher than economist expectations but largely in line with market forecasts following higher-than-expected consumer inflation figures in May. The rate hike was initially viewed as favorable by equity markets because investors appreciated the central bank’s willingness to try to slow the economy while combatting inflation. Markets are pricing in the prospect for continued hikes at the four remaining Fed meetings this year, with the next meeting at the end of July. The Fed also reiterated plans to run off a portion of its balance sheet throughout the rest of the year and into 2023, which is another strategy the central bank plans to take to normalize monetary policy.
What to Look Forward To
On Tuesday, the May existing home sales report was released. Sales of existing homes fell 3.4 percent during the month against calls for a 3.7 percent decline. This brought the pace of existing home sales to its lowest point since early 2020; however, it did leave the pace of sales near pre-pandemic levels. Housing sales surged in the second half of 2020 and remained strong throughout 2021 as shifting home buyer preferences and low mortgage rates spurred purchases. We saw sales spike again in January 2022, but the pace of existing home sales has declined every month since then due to a lack of homes for sale, rising mortgage rates, and high home prices. Looking forward, economists largely expect to see continued headwinds for the housing industry, as rising costs and rates are projected to stifle future sales growth. That said, slowing home sales may help to combat inflation given the large rise in prices we’ve seen over the past year and the importance of housing costs on overall inflation.
Disclosures: Certain sections of this commentary contain forward-looking statements that are based on our reasonable expectations, estimates, projections, and assumptions. Forward-looking statements are not guarantees of future performance and involve certain risks and uncertainties, which are difficult to predict. All indices are unmanaged and are not available for direct investment by the public. Past performance is not indicative of future results. The S&P 500 is based on the average performance of the 500 industrial stocks monitored by Standard & Poor’s. The Nasdaq Composite Index measures the performance of all issues listed in the Nasdaq Stock Market, except for rights, warrants, units, and convertible debentures. The Dow Jones Industrial Average is computed by summing the prices of the stocks of 30 large companies and then dividing that total by an adjusted value, one which has been adjusted over the years to account for the effects of stock splits on the prices of the 30 companies. Dividends are reinvested to reflect the actual performance of the underlying securities. The MSCI EAFE Index is a float-adjusted market capitalization index designed to measure developed market equity performance, excluding the U.S. and Canada. The MSCI Emerging Markets Index is a market capitalization-weighted index composed of companies representative of the market structure of 26 emerging market countries in Europe, Latin America, and the Pacific Basin. The Russell 2000® Index measures the performance of the 2,000 smallest companies in the Russell 3000® Index. The Bloomberg US Aggregate Bond Index is an unmanaged market value-weighted performance benchmark for investment-grade fixed-rate debt issues, including government, corporate, asset-backed, and mortgage-backed securities with maturities of at least one year. The U.S. Treasury Index is based on the auctions of U.S. Treasury bills, or on the U.S. Treasury’s daily yield curve. The Bloomberg US Mortgage Backed Securities (MBS) Index is an unmanaged market value-weighted index of 15- and 30-year fixed-rate securities backed by mortgage pools of the Government National Mortgage Association (GNMA), Federal National Mortgage Association (Fannie Mae), and the Federal Home Loan Mortgage Corporation (FHLMC), and balloon mortgages with fixed-rate coupons. The Bloomberg US Municipal Index includes investment-grade, tax-exempt, and fixed-rate bonds with long-term maturities (greater than 2 years) selected from issues larger than $50 million. One basis point is equal to 1/100th of 1 percent, or 0.01 percent.
###
Zachary R. Sturdy is located at 307 S. Front St., Ste: 107 Marquette MI, 49855 and can be reached at (906)226-6056.
Securities and Advisory Services offered through Commonwealth Financial Network, member FINRA/SIPC, a Registered Investment Adviser. Fixed insurance products and services offered through CES Insurance Agency.
Authored by the Investment Research team at Commonwealth Financial Network.
© 2022 Commonwealth Financial Network®