Weekly Market Update April 25, 2022
Weekly Market Update April 25, 2022
Presented by Zachary R. Sturdy
General Market News
· Considering the upcoming May FOMC meeting, the markets are expecting an interest rate hike of 50 basis points (bps). Federal Reserve (Fed) Chair Jerome Powell solidified his expectation for a half percentage point increase last week. “It is appropriate in my view to be moving a little more quickly,” Powell explained in relation to the most recent 25 bps increase. “I also think there’s something in the idea of front-end loading”. The U.S. Treasury yield curve was up last week, although it saw some flattening with shorter-term rates increasing more than longer-term rates. The 2-year, 5-year, 10-year, and 30-year U.S. Treasury yields were up 23 bps (to 2.69 percent), 19 bps (to 2.98 percent), 8 bps (to 2.91 percent), and 1 bp (to 2.93 percent), respectively.
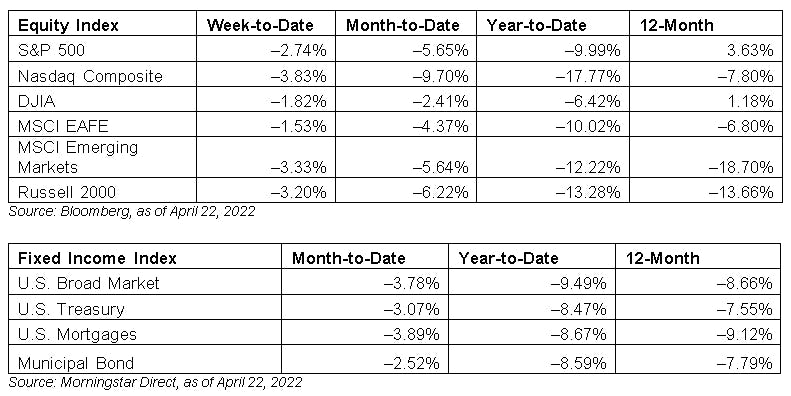
· The S&P 500 was down again last week as markets sold off due to concerns that the FOMC was turning more aggressive in its policy of raising rates. Several committee members issued their thoughts; Fed Chairman Jerome Powell’s statement at an IMF panel discussion that a 50 bps hike will be on the table for the May meeting and that some front-loading of policy accommodation may be warranted. This came following last week’s comments from St. Louis Fed President James Bullard, who cited a desire to hike 75 bps at the meeting. Other members, such as Atlanta Fed President Raphael Bostic and Cleveland Fed President Loretta Mester, remained cautious about moving too quickly. As a result, markets flocked toward safety with REITs (real estate investment trusts) and consumer staples as two top performers. Communication services, energy, and materials were among the worst performers. Communication services was heavily weighed down by Netflix, which beat earnings but missed on revenue. The company lost 200,000 subscribers—its first drop since 2011—but expects to lose 2 million in the second quarter as it looks to crack down on password sharing. The news was a surprise and the stock fell by more than 36.8 percent.
· On Monday, the National Association of Home Builders Housing Market Index for April was released. This measure of home builder confidence dropped from 79 in March to 77, in line with expectations. This is a diffusion index, with values above 50 indicating growth, so this result still signals expansion for home builders, just at a slower pace. Home builder confidence has been well-supported over the past two years, with low mortgage rates, high levels of home buyer demand, and a lack of existing homes for sale supporting faster construction growth. This marks the lowest point for the index since last September, however, indicating that home builders are facing more challenges this year. Rising material and labor costs have weighed on home builder sentiment so far in 2022, and these headwinds are expected to remain at least for the short term.
· Tuesday saw the release of the March building permits and housing starts reports. These measures of new home construction increased more than expected during the month. Housing starts increased 0.3 percent against calls for a 1.6 percent decline, while permits rose 0.4 percent against forecasts for a 2.4 percent drop. Although these reports can be volatile on a month-to-month basis, both starts and permits remain well above pre-pandemic levels, signaling robust new home construction. In fact, the pace of housing starts is its fastest since 2006. The reports also showed that home builder backlogs remain long, driven by high levels of demand, low supply of existing homes for sale, tangled global supply chains, and shortages of skilled labor. Permits and starts at current levels indicate that the pace of new home construction remained strong throughout the first quarter despite headwinds. Continued construction above pre-pandemic levels would be a positive development for the housing sector.
· We finished the week with Wednesday’s release of the March existing home sales report. The report showed that sales of existing homes fell 2.7 percent, following an 8.6 percent decline in February—slightly better than the expected 4.1 percent drop but still marking two consecutive months of decline. Existing home sales surged to a one-year high in January, due in large part to buyers rushing to lock in low mortgage rates, so the slowdown in February and March is understandable. Existing home sales increased notably following the expiration of initial lockdowns in mid-2020; however, signs point to home buyer demand starting to falter. Low supply of homes for sale, increased prices, and rising mortgage rates all serve as a headwind for faster sales growth. That said, the pace of existing home sales remains above pre-pandemic levels, and continued growth at this level would still signal a relatively healthy housing sector.
What to Look Forward To
On Tuesday, the preliminary March durable goods orders report will be released. Orders of durable goods are expected to increase 1 percent following a 2.1 percent decline in February. The anticipated rebound is due to an increase in volatile aircraft orders during the month. Core durable goods orders, which strip out the impact of transportation orders, are expected to increase 0.5 percent following a 0.6 percent decline in February. The drop in core durable goods orders in February was the first monthly drop since February 2021, so the anticipated rebound in March would be an encouraging sign that the slowdown in business spending in February was only temporary. Business spending remained strong throughout most of 2021, and high levels of consumer demand and business confidence are expected to support business spending in the months ahead.
Tuesday will also see the release of the Conference Board Consumer Confidence Index for April. Confidence is expected to increase modestly during the month, with forecasts calling for the index to rise from 107.2 in March to 108 in April. If estimates hold, this would echo a similar increase in the previously released University of Michigan consumer sentiment survey. This would also mark two consecutive months with improving confidence, which would be an encouraging development given that improved confidence has historically supported faster consumer spending growth. High levels of inflation have weighed on consumer sentiment so far this year; however, if we start to see inflationary pressure recede in the months ahead, it could lead to further improvements in confidence and spending growth throughout the rest of the year.
On Thursday, the advanced estimate of 2022 first-quarter GDP growth is set to be released. Economists expect that the economy grew at an annualized rate of 1 percent during the quarter, down from the 6.9 percent annualized growth rate in the fourth quarter. Despite the anticipated slowdown in headline economic growth, personal consumption growth is expected to improve from an annualized 2.5 percent in the fourth quarter to 3.4 percent annualized to start the year. The anticipated slowdown in overall growth in the first quarter is due to slowing government spending as well as high monthly international trade deficits. Both the January and February international trade reports showed record monthly deficits, driven by high levels of import growth that offset rising exports. Looking ahead, economists expect to see moderate growth throughout the year compared to 2021, as tighter monetary and fiscal policies are expected to slow the pace of the economic recovery.
We’ll finish the week with Friday’s release of the March personal income and personal spending reports. Both are expected to show growth during the month, with personal income set to rise 0.4 percent while spending is expected to show a 0.6 percent increase. If estimates prove accurate, this would mark three consecutive months with personal spending growth following a temporary slowdown in spending in December. Personal spending growth has held up relatively well so far year to date, despite the challenges created by high levels of consumer inflation. This is a good sign for overall growth, given the importance of consumer spending for the economy. Personal income has also shown consistent growth, and, if estimates hold, this would be the sixth straight month with rising personal income. American workers have benefited from the strong labor market to start the year as high levels of job openings and low unemployment have helped boost wage growth.
Disclosures: Certain sections of this commentary contain forward-looking statements that are based on our reasonable expectations, estimates, projections, and assumptions. Forward-looking statements are not guarantees of future performance and involve certain risks and uncertainties, which are difficult to predict. All indices are unmanaged and are not available for direct investment by the public. Past performance is not indicative of future results. The S&P 500 is based on the average performance of the 500 industrial stocks monitored by Standard & Poor’s. The Nasdaq Composite Index measures the performance of all issues listed in the Nasdaq Stock Market, except for rights, warrants, units, and convertible debentures. The Dow Jones Industrial Average is computed by summing the prices of the stocks of 30 large companies and then dividing that total by an adjusted value, one which has been adjusted over the years to account for the effects of stock splits on the prices of the 30 companies. Dividends are reinvested to reflect the actual performance of the underlying securities. The MSCI EAFE Index is a float-adjusted market capitalization index designed to measure developed market equity performance, excluding the U.S. and Canada. The MSCI Emerging Markets Index is a market capitalization-weighted index composed of companies representative of the market structure of 26 emerging market countries in Europe, Latin America, and the Pacific Basin. The Russell 2000® Index measures the performance of the 2,000 smallest companies in the Russell 3000® Index. The Bloomberg US Aggregate Bond Index is an unmanaged market value-weighted performance benchmark for investment-grade fixed-rate debt issues, including government, corporate, asset-backed, and mortgage-backed securities with maturities of at least one year. The U.S. Treasury Index is based on the auctions of U.S. Treasury bills, or on the U.S. Treasury’s daily yield curve. The Bloomberg US Mortgage Backed Securities (MBS) Index is an unmanaged market value-weighted index of 15- and 30-year fixed-rate securities backed by mortgage pools of the Government National Mortgage Association (GNMA), Federal National Mortgage Association (Fannie Mae), and the Federal Home Loan Mortgage Corporation (FHLMC), and balloon mortgages with fixed-rate coupons. The Bloomberg US Municipal Index includes investment-grade, tax-exempt, and fixed-rate bonds with long-term maturities (greater than 2 years) selected from issues larger than $50 million. One basis point is equal to 1/100th of 1 percent, or 0.01 percent.
###
Zachary R. Sturdy is located at 307 S. Front St., Ste: 107 Marquette MI, 49855 and can be reached at (906)226-6056.
Securities and Advisory Services offered through Commonwealth Financial Network, member FINRA/SIPC, a Registered Investment Adviser. Fixed insurance products and services offered through CES Insurance Agency.
Authored by the Investment Research team at Commonwealth Financial Network.
© 2022 Commonwealth Financial Network®